How to trade BoC Interest Rates Like a Pro with FXT Economic Calendar
-
 By FXT
 - January 25, 2024
- FXT Analysis
your own account balance and risk tolerance. It’s a balancing act and one that greatly benefits those with the patience and determination to succeed. This article takes you through some of the steps in mapping out a trade plan prior to a big announcement, just like the BoC Interest Rate Decision on the 25th of January 2024.
Deep Dive into BoC Interest Rate Decision
Step one is to open up the FXT Economic Calendar, find the event you want to master and click on Charts. This example is using the USDCAD but other related forex pairs can also be used to dive deeper into the analytics.
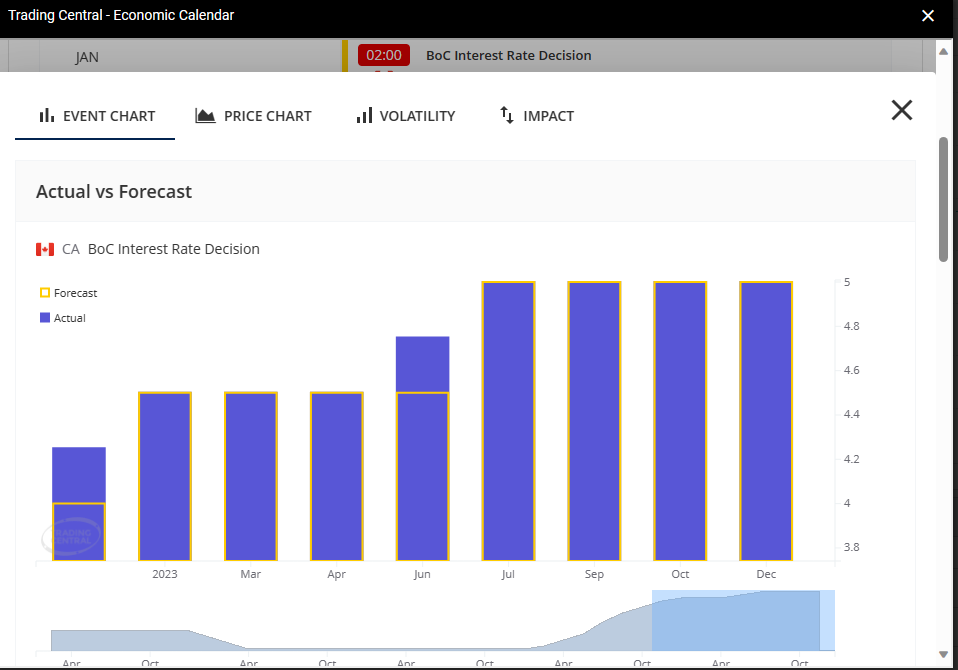
The first chart to show is the Event Chart. This chart shows the recent Actual vs Forecast, and the last 4 have been 5% and 5% for both actual and forecast. Would that likely mean the market is expecting the same result and therefore a limit on volatility will ensue?
Let’s dig further in a moment, but first, consider what this means for the market. The even figures have remained steady for several announcements now and perhaps the market will expect a similar outcome this time too. Take note that the last 4 figures have been an exact match to the forecast.
Effect on Price Chart
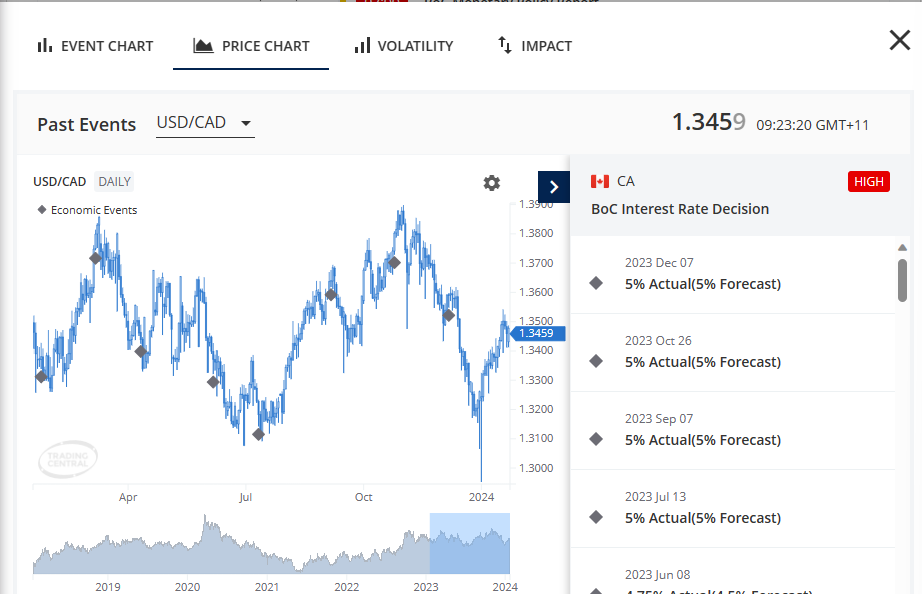
Next up, we have the price chart. We know that the last 4 announcements have been exact, with the forecast hitting the actual right on target. Once again, this forecasted event is 5% also, as seen on the news announcement highlight before entering the charts area.
Let’s make an assumption that the market will match the forecast once again, given the past 4 have been the same. Over the quarters, the market has risen, fallen, risen and finally fallen, with the price positioning being a turnaround, turnaround, continuation and continuation of medium term direction.
The past 4 announcements with the same figures (5%) as we might expect this time around:
Rise and Turnaround
Fall and Turnaround
Rise and Continue
Fall and Continue
To add to the insight, the pricing leading up to each event is also important to note. The trend was seen to be falling in the leadup to the announcement in July for example. Let’s lay out this framework of pricing lead up:
Falling, Rising, Rising, Falling. Currently the price has been rising (on the longer term movement within the quarter).
The matching market layout that closest suits might be considered to be the October announcement, where the market rose up after the event, continuing on from a rally over the past month. Perhaps this could have some meaning when looking for a trade setup on the news announcement.
This overview of course depends on the timeframe that is being traded. The recent pricing leading up to this event has been rising, meaning a rise in price would mean a continuation, while a fall in price would mean a turnaround.
Volatility Brings Life to the Market
Focusing on the matching data to what we perhaps expect this time around, the last 4 announcements may hold the best overview of what we may expect, since the previous forecast figures are matching the forecast with the pending announcement.
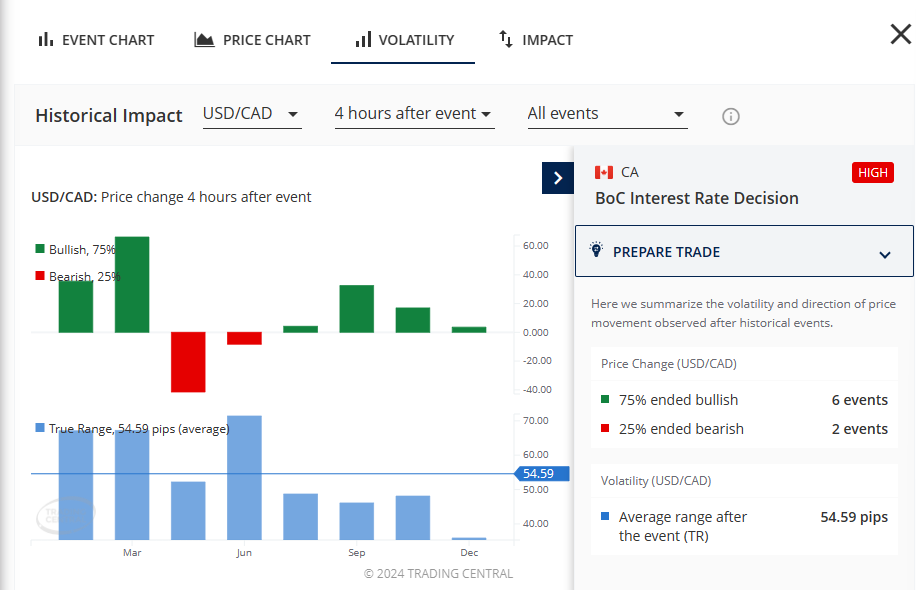
75% of all events were bullish over 4 hours following the event. Each of the 4 recent events (matching the data up) were bullish, bringing up the expectation of a bullish move much higher.
The finishing rise of these recent moves in 4 hours was between 4 pips and 32 pips. Let’s dive a little deeper to see what might be expected on the smaller time frames.
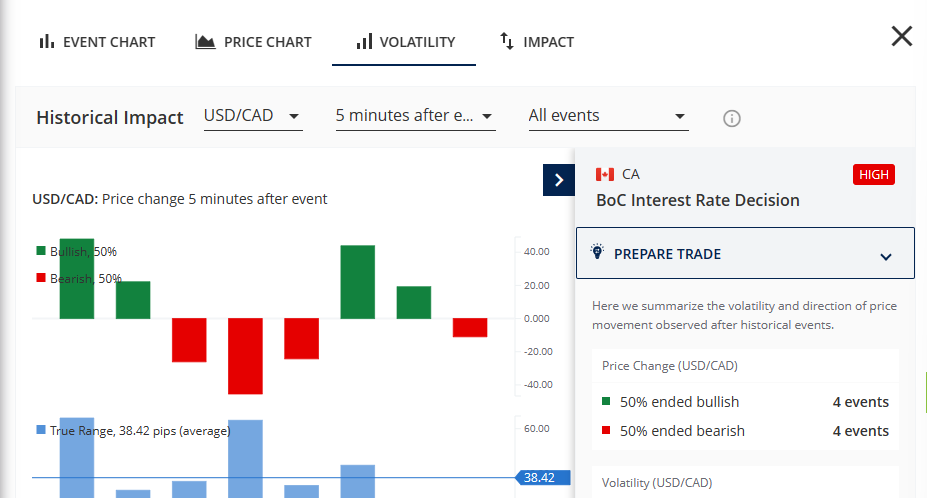
The first 5 minutes shows us a push lower on two of the announcements, with the other two markets already hitting their peak spike.
So what does that mean?
The 1st and 4th announcement has a push down in the first 5 minutes before rising again and being bullish after 4 hours. The two middle announcements already rose almost instantly.
This can be viewed in a number of ways, and as we build a clearer picture of what we might expect on the future trade, we may be able to map out a high probability scenario.
Refine and Dine Like a King
The more you refine your insights, the better idea you might have of what could be coming to the markets at the time of the announcement. Experience is king in financial markets, along with risk management of course.
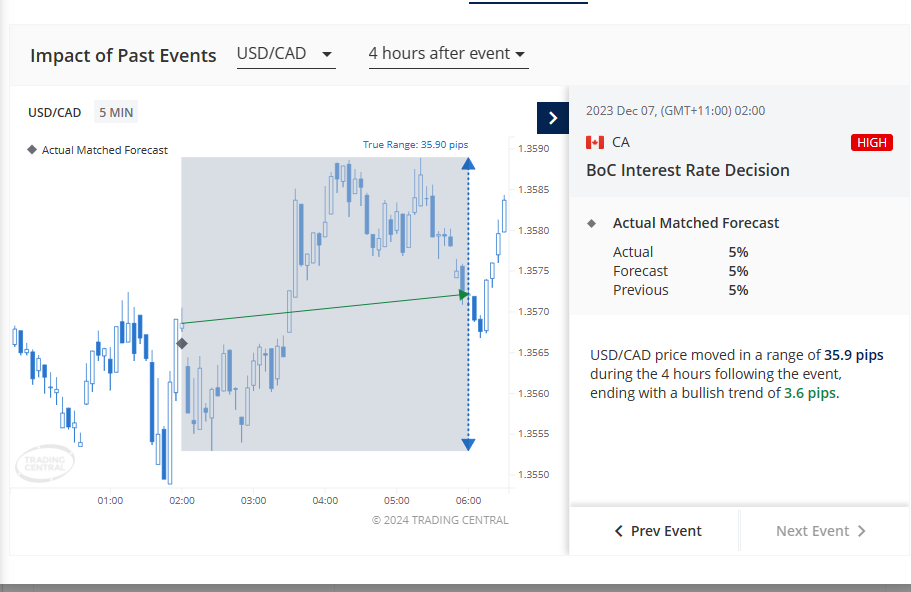
The final chart shows the Impact of what happens on the chart. You can cycle through the previous announcements using Prev Event button to see what happened on the other 4 closely related events that we are focusing on.
What happens is the announcement has pushed the market down (as seen in the 5 minute volatility chart) then rises nicely over the next 2 hours before dropping back to slightly above the starting price when the data was released.
What does this mean? The ideal trade here, would have been to wait for 5 minutes then buy, holding for about 2 hours before closing the position. The event before this held most of the bullish move within the first 15 minutes, with a slight drop on the candle of the announcement. Effectively the same movement happened for the event prior again. The July announcement however, was much like the most recent announcement, where price dropped after the 5 minute candle formed, eventually rising over the next couple of hours.
Putting it All Together – Mapping a Trade Plan
As we know from the Volatility chart, all four similar events ended higher than the announcement time pricing. That leads us to consider the potential for another long position.
If we consider the layout of pricing from the Price Chart, considering the rising, falling, continuation and turnaround, we may be looking for a rising continuation over the quarter.
Using the volatility and price chart to then consider the entry conditions and movement of price at the time of the announcement, one might consider waiting 5 minutes and buying when the market begins to rally.
Confidence might come from the previous 4 announcements all ending higher over 4 hours, along with a level of patience knowing the market may take around 2 hours to hit a peak.
Not Knowing The Trade
For someone that didn’t know this data, and came in to say, let’s sell as soon as we see the market falling, what would you say to them?
While there may be opportunity to sell, based on the evidence from previous data, many of the factors give weight to buying within the first 5 or 10 minutes, particularly after seeing a dip in the first 5 to 6 minute window following the event.
Do you feel this knowledge could give you a serious edge as a trader?
Summary of the Steps
Find a high impact announcement likely to create price movement in the market.
Consider the forecast and your expectation of the upcoming announcement.
Focus particularly on the events that you expect the market to repeat, or have similarities to the current event and your expectations.
View each chart, taking note of the considerations laid out in this article.
Identify likely movement from each chart.
Form a view on the currency pair you have analysed, writing each element down to draw a conclusion of likely events.
Wait for the event to occur.
Trade the event, stick to the plan and always remember risk management.
If you don’t already have it, get an account with FXTRADING.com and use the FXT Economic Calendar to map out each and every high impact event to make the most out of your trading.
Related Posts

Improving your Trading Mindset
- By FXT
- June 28, 2023

Arbidyne February Fund Newsletter
- By FXT
- February 20, 2022

Pros and Cons of Trading News Announcements
- By FXT
- June 6, 2023


