Trading Market Extremes vs. Normalized Market Conditions
-
 By FXT
 - March 29, 2023
- FXT Analysis
Are you a trader that looks for extreme pricing and volatility? Or perhaps you prefer trading in normal conditions where the market isn’t in its most misunderstood pricing zones.
There are two major ways to look at financial markets. This article takes a deeper dive into the considerations and ways to identify each market condition, extreme and normalized.
Trading a Normalized Market
A normalized market is a market that is not being severely impacted by news announcements, abnormal volatility and standard deviation from the mean price is within normal ranges. If the market is considered normalized, it is likely it is in a balanced state whereby it is not ‘trending’ in a particular direction or it isn’t creating bigger swings than is normally seen in that market.
Whether you are an algorithmic trader using MQL4 or MQL5 Expert Advisors, or a manual trader placing orders and watching the charts, it will help to understand what makes up a normalized market.
When price is within a range and trading inside the Bollinger Bands or Keltner Channels, it could be considered in the normal range as the price is within the standard deviation based on your indicator preferences. Using indicators such as Bollinger Bands, Keltner Channels and Moving Averages could help traders eliminate outliers from their strategy and stay out of trades when price is not in a normal range. Of course, these settings would need to be examined by the trader. Some traders may consider a price within standard deviation of 2 to be normal, however stricter conditions may require a standard deviation of 1 to be considered normal.
Consistency in direction may be something traders would also need to define normalized. If the market is trending upwards, traders may want to see the mean price met and then continue in the ‘normal’ direction, rather than looking for reversals and a change in direction.
What are the Benefits of Trading a Normalized Market
The benefits of trading a normalized market include the use of normal conditions in pricing, meaning the predictability should be higher as the trader looks to take advantage of pricing patterns that play out over and over again. While the trades may be smaller, they could also be less volatile compared with outlier pricing conditions.
As trades play out over and over, the statistics could also be built up faster as setups may occur more frequently. More trades means increased data to assess and work with in order to tweak the strategy.
Additionally, in the normalized environment, traders avoid new and novel pricing areas, market conditions and volatile markets such as news announcements and extremities in pricing. This means traders focus on tried and true areas of the market only when the market is in a moderate to low volatile price.
Trading Market Extremes
The trading of an extreme market means trading in times of impactful news announcements, high price volatility and times when price is outside of the normal pricing outside of the standard deviations, which can be measured by Bollinger Bands and Keltner Channels.
When markets are priced outside of their normal trading range, traders look to rebalance the imbalanced market, often looking to send price back the same direction from which it came. Trading reversals in these market extremes places opposing pressure on price, with the intention of creating and taking part in a reversal in price to bring the market back into normal conditions.
Markets that are imbalanced and out of the normal conditions could be considered more difficult to predict. This is partly due to the new and generally unseen pricing and market conditions for that market, but also the pressure and volume that brought the market outside of these normal conditions is often unpredictable and the degree of change is unknown. Put simply, the market could keep steamrolling further beyond the abnormal pricing with no end in sight. Some traders may look to trade breakouts as the market continues to move into abnormal territory, however many traders like to help rebalance the market by looking for a reversal.
This style of trading may contain higher risks, or bigger moves in pricing (risk can be controlled by reducing initial volume of positions during higher volatility). The rewards on the other hand, are often aiming for larger movements or perhaps more certainty when the conditions are met, but the setups are likely to be less frequent.
How to Find Market Extremes
Keeping an eye out for market extremes manually (looking at a chart) would be very time consuming and often times boring when markets remain inside ‘normal’ ranges. Fortunately, there is another way!
The FXT Navigator has a feature called the Screener, which allows traders to scan the entire market for certain conditions. Instead of checking all charts and cycling through every symbol in your Market Watch, you can use the FXT Navigator to run a screen against Bollinger Bands (BBands) and see what is in play right now.
As you can see in the screenshot, on a daily chart setting with bands deviation of 2 and occurred within the last 5 candles, the EURCAD, EURHKD, EURNZD, EURTRY and EURUSD have all reached outside of the Upper Bollinger Band within the last 5 days (candles). For traders looking for opportunities now, they might want the Checkpoint (when the setup happened) to be 1 or 2 candles. Traders can use this tool every time they want to look for a setup and simply check the dashboard to quickly scope out pages of trade opportunities to see what is setting up.
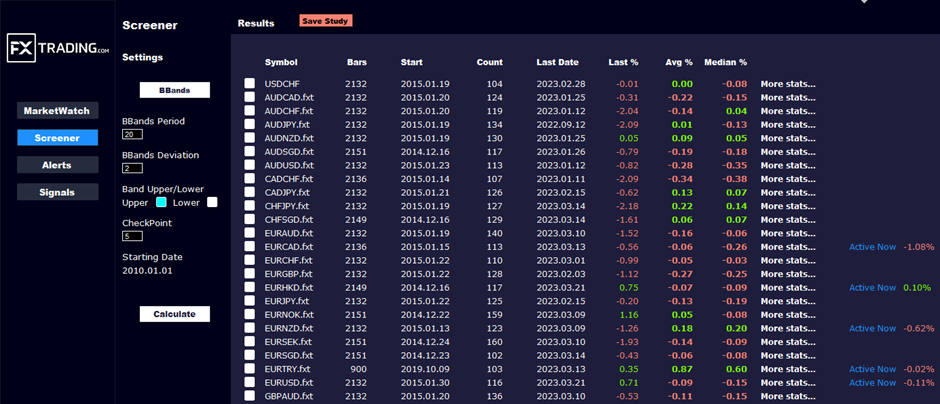
Based on the data shown, the rejection trades (hitting the Upper band price, then price falling as depicted by the red % next to ‘Active Now’) have combined to be the majority of price moving down after touching the upper band. Only one of the trade setups shows to be moving upwards and it is very slight and perhaps newer (within 5 candles) than the other setups.
On top of being able to see a setup quickly, across all of the markets in your Market Watch, you can also see the back tested statistics of the setup previously to help build confidence in the strategy you are going for on that particular symbol.
Get your FREE Screener by downloading the FXT Navigator today and enjoy using data backed analysis and easy to find setups every day.
Related Posts

Trump is Officially Impeached, Now Its Over to the Senate
- By FXT
- January 14, 2021

Mastering Forex Trading - Strategies to Optimise Your Profits
- By FXT
- July 5, 2023

Bank Bailouts – The Money Goes Somewhere
- By FXT
- March 21, 2023


