GBP/USD Slides. Can the Pound Recover?


UK inflation has edged higher, driven primarily by rising energy prices, while underlying price pressures remain relatively stable. Meanwhile, persistently elevated US inflation has reinforced expectations of further monetary tightening by the Federal Reserve, supporting continued US dollar strength.
Against a backdrop of diverging monetary policy expectations and sustained safe-haven demand, GBP/USD remains under pressure.
From a technical perspective, the pair has broken below a key support zone, with bearish momentum strengthening in the short term. Market participants should continue to monitor lower support levels and the potential strength of any recovery.
Macroeconomic Overview
UK Inflation Edges Higher as Energy Prices Drive Price Pressures
UK inflation picked up slightly in October, with rising energy prices emerging as the primary driver of the increase in headline inflation.
According to the latest data, the UK Consumer Price Index (CPI) rose 3.6% year-on-year, up from 3.5% in September and in line with market expectations. On a monthly basis, CPI growth accelerated from 0.4% to 0.5%, reflecting an increase in short-term price pressures.
However, core CPI, which excludes food and energy prices, remained unchanged at 2.8% year-on-year. Services inflation also held steady at 3.7%, suggesting that rising price pressures have not broadly spread across other areas of consumer spending.
Meanwhile, the Consumer Prices Index including owner occupiers’ housing costs (CPIH) increased to 3.7% year-on-year, compared with the previous reading of 3.6%.
A closer examination of the inflation data indicates that rising fuel costs have contributed significantly to the increase in headline inflation, while core goods and services prices have yet to show signs of a simultaneous acceleration.
The Bank of England (BoE) remains focused on how changes in energy prices could affect household purchasing power and future inflation expectations.
Although the latest inflation figures indicate renewed pressure on headline prices, the stability of underlying inflation suggests that broader price pressures remain relatively contained.
Hawkish Fed Expectations Continue to Support the US Dollar
In the United States, several recently released inflation indicators have exceeded market expectations, prompting Federal Reserve officials to reassess whether the current monetary policy stance is sufficiently restrictive.
Several key members of the Federal Open Market Committee (FOMC) have delivered hawkish signals, suggesting that further monetary tightening may be necessary to bring persistent inflation under control.
According to the CME FedWatch Tool, markets have fully priced in a 25-basis-point interest rate hike in December, while maintaining a smaller probability of a more aggressive 50-basis-point increase.
Expectations of tighter monetary policy have kept US Treasury yields elevated, reinforcing the yield advantage of US dollar-denominated assets.
At the same time, ongoing geopolitical tensions in the Middle East have increased uncertainty across global financial markets, prompting some investors to seek safety in the US dollar.
These factors have helped keep the US Dollar Index near its highest levels since April 2025.
Looking ahead, upcoming US inflation data and comments from Federal Reserve officials will remain important in shaping market expectations regarding the central bank’s future policy path.
With UK inflation pressures largely concentrated in the energy sector and US monetary policy expectations becoming increasingly hawkish, the US dollar continues to exert downward pressure on GBP/USD.
Technical Outlook
GBP/USD Breaks Below Its Trading Range as Selling Pressure Intensifies
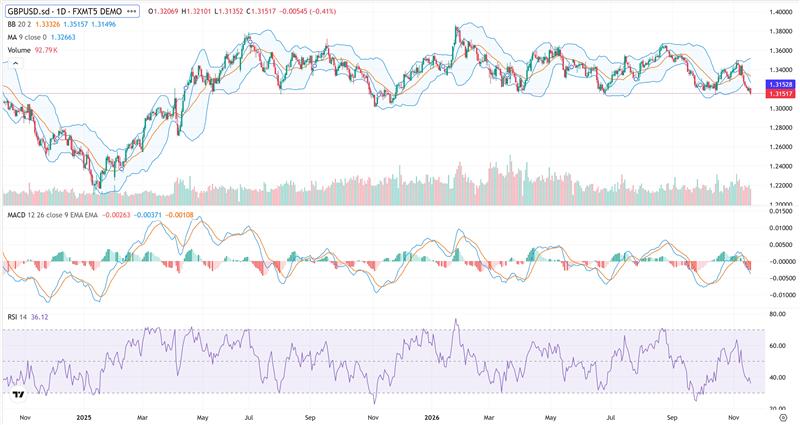
From a daily chart perspective, GBP/USD has failed to sustain its recent recovery. After encountering resistance near 1.3500, the pair has declined consecutively and is currently trading around 1.3152, with sellers regaining control in the short term.
The pair had previously fluctuated within a range between 1.3200 and 1.3500. However, the recent breakdown below the lower boundary of this range indicates that selling pressure has intensified.
On the downside, the 1.3150 area currently represents the first immediate support level.
If a daily close confirms a breakdown below this level, GBP/USD could extend its decline towards 1.3100, followed by the key psychological level of 1.3000.
On the upside, the previous support level at 1.3200 has now turned into short-term resistance.
If the pair manages to reclaim and hold above this level, a recovery towards 1.3266 could follow. However, unless GBP/USD breaks above 1.3333, the broader technical outlook is likely to remain bearish.
Technical Indicators Point to Strengthening Bearish Momentum
Technical indicators suggest that downward momentum has intensified, with limited evidence of a meaningful short-term recovery.
GBP/USD has broken below the middle Bollinger Band at 1.33326 and is gradually approaching the lower band at 1.31496, reflecting increasing downside pressure.
The upper Bollinger Band is currently located at 1.35157. With prices continuing to trade below the middle band, the pair has yet to generate a convincing bullish reversal signal.
The 9-day moving average stands at 1.32663, significantly above the current exchange rate, further indicating that sellers remain in control.
Meanwhile, the Moving Average Convergence Divergence (MACD) indicator continues to reflect bearish momentum.
The MACD line has declined to -0.00371, while the signal line stands at -0.00108. The histogram has turned negative again, suggesting that bearish momentum is building.
The Relative Strength Index (RSI) has fallen to 36.12, placing it in bearish territory. However, it remains above the conventional oversold threshold of 30, indicating that the pair may still have room to decline.
Taken together, these indicators suggest that GBP/USD remains vulnerable to further downside pressure.
In the near term, market participants should closely monitor whether the lower Bollinger Band can provide sufficient support or whether a further breakdown could extend the current decline.
Conclusion: GBP/USD Remains Under Pressure as Dollar Strength Dominates
Overall, GBP/USD continues to face significant downward pressure in the short term. The recent increase in UK inflation has not been sufficient to offset the US dollar’s strength, while hawkish Federal Reserve policy expectations continue to support the greenback.
From a technical perspective, the pair remains below both the middle Bollinger Band and the 9-day moving average. The MACD remains in negative territory, while the RSI has yet to reach oversold levels, suggesting that sellers continue to hold the advantage.
If GBP/USD breaks decisively below 1.3150 and the lower Bollinger Band at 1.31496, the pair could extend its decline towards 1.3100 and potentially challenge the psychological support level of 1.3000.
Conversely, if GBP/USD manages to reclaim and hold above 1.3200, a short-term recovery towards 1.3266 could develop. Nevertheless, until the pair breaks above 1.3333, the broader bearish outlook is likely to remain intact.
Looking ahead, UK inflation developments, Federal Reserve policy expectations, US Treasury yields and geopolitical tensions will remain key factors influencing the next direction of GBP/USD.
Whether the pair can defend its immediate support levels or recover above key resistance will be central to assessing its next move.